Chief Scientist Jim Ledwell's Daily Journal
DIMES Deployment Cruise: RR0901
Ship: R/V Roger Revelle
10 January 2009
Revelle departed Punta Arenas at 0800 L (1100 Z) in fine weather and sailed through the Strait of Magellan to the Pacific. The scenery was fine. A fire and boat drill was held during the transit.
11 January 2009
Revelle reached the Pacific around 0300 Z and turned south toward the site of the first mooring deployment. Weather was moderate with the ship in the trough, handling it well. The habit of a science meeting at 1600 L with the science party and the ship’s technicians, and with the captain invited, was established.
12 January 2009
Revelle exited Chilean waters at approximately 0800 Z. Data collection started with the shipboard instruments, which comprised:
- RDI 150 khz narrow band ADCP
- Knudsen Subbottom Profiler
- Hydrographic Doppler Sonar Sampler (HDSS)
- Simrad EM-120 Multibeam mapper
- (2) Thermosalinographs, with Oxygen and Fluorometer
- The meteorological instruments were already running, since leaving port:
- (2) Wind speed and direction packages
- Relative Humidity
- Long wave radiation
- Precipitation
- Air temperature
- Pressure
A 1000-m XBT was deployed to calibrate the Multibeam. The Multibeam was then used to survey the area for the first sound source mooring. The bottom was bumpy at the planned site, but smooth 5 km to the east, so we moved the deployment line there. 300 m of cable were added to compensate for a greater depth than planned, due to moving the mooring site out of Chilean waters.
The first sound source mooring was deployed, starting at around 0745 L, right after breakfast, and finishing at around 1200 L, just on time for lunch. The only snag was that the quick release did not work for the sound source and Brian Guest had to cut the source free.
Later on this same day we learned that the 4 sound sources of new design by URI for high power would not last more than 2 years. Also, there is enough concern about the firmware on them that we were advised to revert to an earlier version of the firmware. It’s too late for the source just deployed, but Peter Lazarevich will reprogram the firmware on the other high power sources. After discussion on board and with Kevin Speer on shore we have decided to substitute an older, spare, URI source that was brought along for one of the high power sources, the one at 58 S, 98 W. The other two of the six sources are older ones, from Webb Research.
In the afternoon of the 14th Brian Guest and assistants wound the lines for the next mooring, finishing on time for dinner, when the weather was picking up again.
13 January 2009
The weather was heavy again on this day, with winds from 30 to 40 knots most of the day, while we traveled to the next mooring site. A SOLO float, with RAFOS receiver was deployed about 300 km west of the sound source deployed on the 12th. It will surface in 10 days, and tell us whether the source is performing properly.
14 January 2009
More heavy weather today, though we were comfortable on the ship. Unable to deploy the second sound source mooring due to swell., we waited at the site for 12 hours. Finally the wind subsided from 30 to 40 knots to 20 to 30 knots and the pitching of the ship came down a little, so we started deploying at 1900 L. I took pictures of Brian and the work party getting the sound source in. It is quite an operation, with about 9 people on deck, each handling a line, winch, capstan, tugger, or A-frame. This was a Webb source; heavier than the URI sources and older, but better known. The wind has now come down to around 5 knots. We have not seen that for a while.
15 January 2009
Today we steamed due south to deploy the third mooring near 60 S, 86 W. The weather started relatively calm but the wind built during the day to 20 to 30 knots by the time of the mooring deployment. The mooring has just now begun to be deployed.
We held our first reading group tonight, on Munk and Palmen (1951), with me and the students attending.
16 January 2009
The third mooring went in early in the morning. We then steamed toward the fourth mooring. Seas were a bit rough. Speed was less than 10 knots much of the time. A SOLO float was deployed towards the end of the day.
Peculiar temperature profiles are coming out of the XBTs, with strong inversions below 250 m, many of which match in depth from cast to cast.
I read Orsi et al., 1995, and have learned about their view of the fronts of the ACC and rules of thumb to identify them.
17 January 2009
The fourth mooring was put in by the end of the day, with no trouble. It was a tough night to sleep last night. I napped a few hours today and took another Dramamine – or the Chilean version thereof.
18 January 2009
The weather was fine during the mooring last night and for the steam to a CTD station at 59.75 S, 105 W. We were surrounded by ice bergs most of the day, of which many pictures were taken.
I realized today afforded an excellent opportunity to get the CTD wet and to find out something about where the fronts were. I expected from the XBT profile and surface T and S that we were on the northern side of the SAF back at the last mooring, at 58 S, 98 W, and, from following the altimetry contours, that at the station for today we would be at the southern edge of the SAF. It turned out that we are instead south of the main PF. The temperature at the T minimum was 1.3 C, and the depth was 180 m. The 27.9 neutral density surface was a little less than 1100 m deep. I was fooled because the southern part of the SAF apparently merged with the PF at an eddy in the later. In any case, this was a big relief, since it looks as though we can leave nothing in the water south of 60 S due to the Antarctic Treaty, and our oversight of not getting clearance for our instruments. The first CTD cast went well, in calm seas. We took it to 125 m above the bottom - no deeper because we had no altimeter or pinger. An altimeter has been located, though, and so the CTD line will be done to 50 meters or less above the bottom. (We have a pinger but it is very large and heavy and would be difficult to mount on our compact CTD frame.) We also released the third SOLO float, with RAFOS receiver tonight, and are on our way to deploy the fifth sound source mooring.
19 January 2009
The fifth sound source was deployed in quiet seas after lunch at 110 W, and a little north of 60 S. 200 m of rope were added due to greater than expected depth, but the bottom was very flat. An XBT dropped before the mooring (XBT 07) showed us to be near and south of the PF with a temperature of 1.7 at the T-minimum, and this is consistent with the location in the jet on Valery Kosnyrev’s map of ADT (Absolute Dynamic Topography). The weather remains fine and we are on our way to the last mooring site, at about 12.3 knots.
I attempted to send off a .mat file with last nights CTD profiles to DIMES investigators, but it may not have gone out. Around noon we lost contact with the Satellite service we enjoy, being on the outer edge of reception for it. We may not be on line again for a few days.
20 January 2009
The last mooring was deployed today, in sunshine that had followed a heavy snow squall. The wind picked up to 35 knots by the end of the deployment, but the swell was mild during the deployment.
I am relying heavily on Valery’s altimetric maps to plan the CTD line, to advise on the float deployment plan, and to anticipate the tracer injection site.
I plotted all the XBT profiles obtained thus far. It seems to often happen that PF water overlies SAF water, and vica versa, leading to strong inversions in the vertical temperature profiles. I am not sure how common or believable this. One of the large inversions seems clearly to be a faulty deployment or probe. The others seem reasonably located between the two endpoints of PF and SAF characteristics.
21 January 2009
We’ve been steaming most of the day down swell at more than 12 knots with 20-30 knot winds behind us. The only interruption for data was for the first T5 (1830-m) XBT at 52.68 S. It was disappointing in that there were two bad spikes. However, it showed that we were north of the SAF, as characterized in WOCE P18, though we still have a strong ADT front to go through at 52 S, which we are calling the northern SAF.
We decided on CTD/XBT section and RAFOS deployment stations today, with a mix of CTDs to the bottom and T5 XBTs between 50 and 58 S, and then CTDs every ½ degree from 58 to 64 S, and more at fronts. We’ll go all the way to the ice edge at 70 S if time and weather allow. RAFOS floats will be released between 53 and 60 S in 22 triplets, generally every 1/3 degree.
22 January 2009
Three CTD stations have been occupied today in our section (CTDs 2, 3, and 4), and numerous XBTs have been dropped. The CTD data look good; the XBT profiles are plagued by a fault. The XBTs have managed to help track our progress through the SAF, but they will not make a very complete temperature section and certainly will be of little use for dynamic calculations. We have not solved the problem yet despite thorough efforts by Jon Meyers and Brian Guest to swap gear and search for ground loops. The PC board has not yet been swapped. We are currently between 51 and 52 S where the steepest dynamic topography in the altimetry maps resides (at 105 W), even though it is the northernmost part of the SAF.
Winds have been 15 to 30 knots all day, and swell has been moderate. The wind seems to be dying now and the next few days promise to be smooth.
23 January 2009
CTD stations are progressing apace. We are now on the sixth cast of the CTD line, at 54 S, and here we will launch the first 3 RAFOS floats once the CTD is on board. The XBT operation is limping along, sometimes giving good data beyond 1000 m, but others only to 400 m or so. The altimetry data for 1/20/09 show a nearly constant slope at 105 W between 53 and 58 S, representing what I believe is a smeared out SAF, so the sparse CTD stations (1 degree between) may adequately resolve the situation. The PF is still between 58 and 60 S, where we will do CTD stations every ¼ degree.
The first SOLO floats we released should have come to the surface today. We are anxious to know whether it received any signals from the eastern sound sources, but for that we must wait for word from on shore.
Reading group met again today, to discuss the paper by deSzoeke and Levine (1981). We also started to discuss eddy fluxes in general, and also property-following paths and coordinates for the ACC.
24 January 2009
We are continuing our CTD/XBT line, while deploying RAFOS floats in triplets every 1/3 degree, expecting to reach 57 S tonight. We are also releasing a surface drifter now at every station (we brought 15 of these with us). It looks as though there is a window of relatively calm weather later next week, starting Wednesday around the tracer injection site, if such long range predictions are to be relied on. Given that, and the possibility of much worse weather at any time, I have decided to break away from the present CTD line at around 61 S, about 2 stations south of the last RAFOS deployments. It is possible that we will resume the line after the tracer injection and sampling phases, repeating perhaps two stations (adjustments made for movement of the sea surface height pattern). Of course, this is not the best way to do a CTD line, but once the floats are in, the tracer injection becomes the highest priority by far, and so we must not jeopardize that component by going too far south on the CTD line.
25 January 2009
We had to break off at noon today due to a medical emergency. One of our crew members had heart trouble last night, quite possibly a mild heart attack, and we must get him back. At the time we broke we had finished the CTD cast at 58 S, finding the target density surface at 1575 m depth. Hence, we are near the latitude for tracer injection, since the PF is just to our south and the target surface will shoal dramatically across it. This view is based on altimetry and the first CTD cast done earlier in the cruise near 60 S, 105 W. We have released 36 RAFOS floats in triplets from 54 S to 57-40 S at 20-mile intervals. So we have 39 RAFOS floats left. Perhaps it is good that we have a break to see if the sound sources are working, and if they are not, to consider our strategy for releasing the floats.
It will take us 4 days to get in to Punta Arenas or near enough for a transfer of our ill crew member to a ship or aircraft, and then it will take a little longer than that to get back – against the prevailing wind direction. I will request that we get into port one day later than planned, on 24 February. We will finish the float deployments, scrub the rest of the CTD line to the south, and hustle to inject the tracer and try to get 6 to 8 sampling tows in. We need luck and good weather, but I believe we will certainly get the floats and tracer in, and we will get at least a few sampling tows.
29 January 2009
We have left our crew member off and are our way back to the site. We have been busy getting ready for the tracer injection and organizing a cruise report, so the time has been well spent. Last night our reading group had a pleasant discussion centered around the paper by Greg Johnson and Harry Bryden on the dynamics of the ACC.
The skipper has the ok to run on all three engines so we should get back faster than I expected, perhaps in 4.5 days. We have been granted the extra day for the cruise, returning on 24 February instead of the 23rd. I estimate that we will have a good 16 to 17 days on site. We’ll spend about 2 days on CTDs from 60 S to 58 S, then 3 or 4 days on the tracer injection, 2 or 3 days on the transition to sampling and then may get 8 sampling tows in if the weather cooperates. Fewer sampling tows will be adequate, but eight is the number I have become comfortable with to document the initial diapycnal distribution of the tracer.
We are planning to deploy three RAFOS floats every 15 miles between 60 and 58 S, and then four more sets of three, along with shearmeters, during the tracer injection. One each of the three EM-APEX floats will be deployed before, during and after the tracer release. We have two SOLO floats, without sound sources, which will be deployed during the release.
30 January 2009
We have been steaming on three engines against some heavy seas, so we are all getting used to motion again after 4 days of steaming down swell. Good progress has been made on setting up the injection sled. The autosal is giving us huge headaches. A cruise report is coming together. Most in the science party are working on sections of it, while I try to organize and write the main narrative.
We are helping out in the galley since we lost the cook and now his assistant is very busy. This is possible for us while we are not deploying anything. I am not sure it can work well after we are on site again.
1 February 2009
We’ve been steaming through relatively calm waters for the past 2 days or so. However, the weather is predicted to deteriorate on the 4th and stay rough until the 9th, if one can trust the long range forecast. Thus, I have decided to try to do the injection as soon as we get to the site. We will have about 36 hours before the seas build again. The fear is that the injection sled will be difficult to recover in heavy seas, and also that strains on the cable will be great, as the sled rises and falls with the sea surface while the CTD cable and the crane cable will be relatively stationary.
We therefore spent today making the final preparations for the injection. The Niskin bottles on the CTD rosette system were wrapped up for protection from the tracer and stowed in the hold, and the tracer reservoirs, which we call “accumulators”, were filled with tracer. Of the nominally 84 kg that we received, we were able to transfer about 79 kg into the accumulators. The remainder is presumably due to high boiling point impurities and CF3SF5 at low pressure left behind in the tanks. There was no doubt some round-off error in the amounts reported to be sent too. We did try to pump residual CF3SF5 from the tanks to the accumulators using a pump designed to be able to take gases from vacuum to 4 atmospheres pressure, but that process was slow and I was beginning to fear that we were transferring impurities rather than the tracer so we stopped after less than a kg was transferred in this way.
3 February 2009
We arrived on site yesterday at around 2030 and immediately set up to inject tracer. The injection sled was charged with over 40 kg of CF3SF5 and this was injected smoothly by noon today. After the injection streak was completed and the sled on board, we moved to the center of the injection area and released a number of floats: 3 RAFOS floats, 1 EM-APEX float, 1 SOLO float, and 1 Shearmeter float. We tried to start the second injection streak with the remainder of the tracer, but the pumps failed shortly after getting the sled in the water. After several hours of troubleshooting we found that the lead-acid batteries were at fault. No doubt we should have discovered this more quickly but I think that fatigue, rainy weather, and a sled that is difficult to work on interfered with our wits, though we were trying to be methodical in our approach. We are now waiting for the batteries we used on the first streak to gain enough charge to power the second streak.
5 February 2009
We have injected all the tracer (about 80 kg). There were some adventures in electricity and pressure sensors, and pumps, but we are finished and it went well. The pressure of the injection varied from 1560 to 1590 dbar. Our target for the injection was potential density = 34.6077, reference to 1500 dbar. Sigma_theta is then approximately 27.6745; neutral density 27.9. It took us from about 0030 Z on 3 Feb to 0600 Z on 5 Feb to do this injection. Recovery of the injection system with the relative motion between sea and Revelle, and high freeboard on Revelle is not easy. The last recovery was in heavy seas and was flawless, thanks to Brian Guest and the team working with him. No doubt we have more adventures before us, but these last two days were I think among the most challenging and important of the cruise.
We transferred from the sled to the CTD/Rosette system this morning, and we launched a second shearmeter, 3 RAFOS floats, and a SOLO float. The we started a grid of CTD stations around the injection area at 12-mile spacing, nine stations. We are working our way around the box, doing a new cast every 6:12 h. Not that the M2 internal tide is expected to be large, but there could be a peak there and the 6 hours between stations will allow us to make the transition between injecting and sampling at a reasonable pace.
6 February 2009
The grid of CTD stations continues, 6 of the 8 stations having been completed. The western limb gave a zonal velocity of -3 cm/s at 1500 m in a peak that looked like a high-mode wave, really. The limb in the north gave a meridional velocity of -2 cm/s at 1500 m depth. At present we are on the slope of a 2000-m high seamount in the central station along the eastern limb so we will not get deeper than about 3700 m.
We are making slow progress on venting tracer-rich components after the injection, and setting up the GC system. There is perhaps too much else going on with the CTD casts, and float preparation. The pace is only going to increase when we get back to the line at 105 W, 58 to 60 S. This will be tomorrow night, and go until the morning of the 8th.
7 February 2009
We finished the box of stations around the tracer injection area on 7 February, but were unable to do a station at the center of the box, as planned, or to release floats there due to an increase in the wave height. The box, however, gave us what seems to be valuable information. The box is 24 miles on a side with stations at the corners and at the midpoints of the sides. We have calculated the geopstrophic flow at 1500 to 1600 meters depth, where the tracer is, using the saltellite-derived sea surface height as reference. We get a northward velocity of 3.5 cm/s across the southern line, a southward velocity of 1.5 cm/s across the northern line, a westward velocity of 3 cm/s across the western line and an eastward velocity of 2.2 cm/s across the eastern line. That is, we have meridional convergence balanced by zonal divergence. No doubt, the accuracy of the balance I just luck. Nevertheless, the calculations have reinforced the image of a hyperbolic point where the tracer is.
Estimates of the velocity components near the center of the box from geostrophy are all less than 1 cm/s, and not entirely consistent with one another. The EM-APEX float that was deployed also supports a velocity of about 1 cm/s, to the south, near the center of the box.
The sea state from 7 to 9 February was rough, with winds often from 40 to 50 knots. We did finally occupy the middle station of the box, but float deployments are out of the question. The RAFOS floats are fragile due to the heavy mass of the compressee, loosely tied to the bottom of the float. We will wait for calmer seas before deploying any more of these, and this decision puts off our return to the CTD/float line at 105 W.
One thing that we have been able to do, during periods when the sea state and winds are not quite so fierce, is CTD stations to search for tracer. We decided not to try to deploy the towed array of integrating samplers for the time being, for several reasons, but lately the most important one has been the sea state. So, having cleaned up the sources of tracer on the ship, we put all the Niskin bottles on the rosette and started fishing for tracer. We have found hot spots of tracer at the location of the release, and quite a few places in the same general area where there is no tracer (attached figure). The tracer was released in a cross pattern. It is not easy to say which arm of the cross we have found, given the uncertainty in the currents. It has been 4 to 6 days since the injection. We are feeling our way along what we perceive to be one of the arms, but it seems a slow process, and is a lot of work, with CTDs nearly every two hours when the sea state allows, and lots of samples to run through the gas chromatograph (GC).
Setting up the GC more quickly than planned, to respond to the opportunity to sample tracer, kept me up all of Saturday night, and then running samples kept me up most of Sunday night. I have managed enough naps to feel OK right now (Monday Afternoon). We have just brought up Cast 34, which is the tenth tracer cast that we have been able to do with the weather since early Sunday morning. Three of these casts have yielded tracer. Only one of them has yielded a full, healthy profile. These casts go to 1800 dbar. We have tested for contamination of the sampling apparatus, by the way, and have found none. Our efforts to protect the Niskin bottles, sampling syringes, and GC gear have been successful. These items were stored in the forward hold, wrapped up in stretech wrap, tight plastic boxes or heavy plastic bags.
We are encumbered in where we can sample by the presence of ice bergs, which always seem to be headed where we want to go. At present we are upwind of a large one and following it east to a site where I think we can pick up the trail of the tracer again.
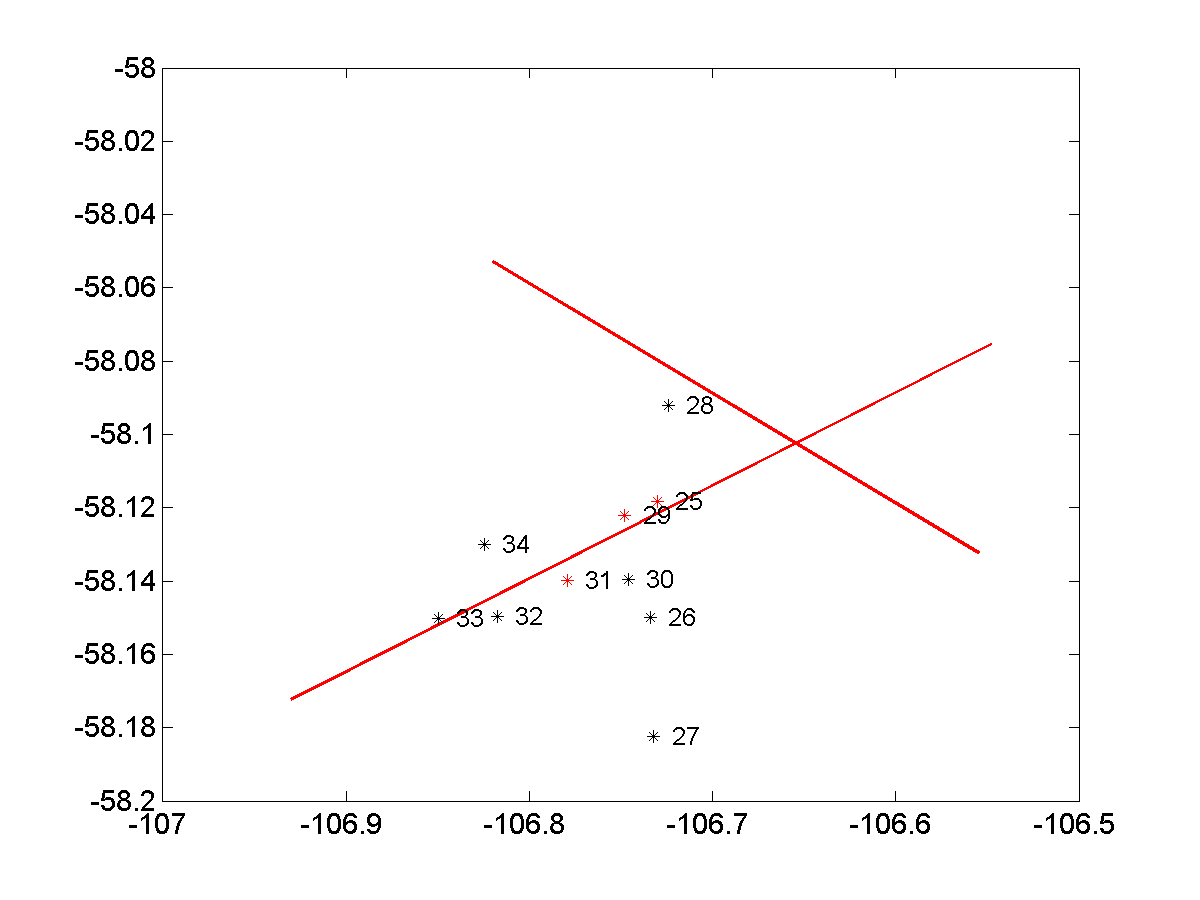
Figure Caption: Tracer injection lines, and CTD stations for the tracer search. Stations at which any tracer at all was found are in red. The others are in black. The only station so far that has found a robust tracer profile is 29. Station 25 found a large concentration at one level and small concentrations at a few other levels. Station 31 found just one level with a small concentration. The sampling pattern is affected by avoidance of ice bergs.
11 February 2009
Our search for tracer continued until around midnight, last night, when the wind picked up and the sea was confused due to a switch to northeasterly wind. At about this time, the GC was performing poorly enough for me to interfere to check for leaks. This turned out to be a near catastrophe because the GC did not come back to a normal life after the leak check and an attempt to tighten some fittings near the detector. Two casts of samples backed up. I was glad to call the cast due to bad weather and went to bed. The fact that I could sleep with two malfunctioning GC’s (the spare did not come right up either) attests to how tired I was. This morning we came up with a simple, temporary fix for the spare GC and were able to run the backed up samples. At the same time we decided that the weather forecast was promising enough for us to move to the start of the CTD/LADCP/RAFOS line, especially if we started it at 60 S and went north rather than at 58 S and moved south.
The tracer search thus far was done with 23 CTD casts, in six of which we found at least some tracer (Fig. 1). The process is so painstaking, labor intensive, and of low yield that I am eager to call into play the towed sampler array. In fact we have started to prepare the array in anticipation of relatively smooth seas when we return to the injection site two days from now.
So we are currently at the first CTD/LADCP line at 59-59 S, 105 W. We will release triplets of RAFOS floats every 15 miles going north, and triplets of surface drifters here, at 59 S and at 58 S. CTD/LADCP casts to the bottom will be made every ½ degree. XBT’s will be dropped at the intervening ¼-degree points. One might be concerned about how well this little section will match the one done earlier between 50 S and 58 S. Fig. 2 shows a comparison of the absolute dynamic topography from the satellite data for 25 January, the date of the end of the earlier line, and 8 February, the most recent date for which the method used by Valery Kosneyrev can give us an estimate. We see that the differences are modest, especially at 58 S and across the jet between 58 and 60 S.
Fig. 3 shows the dynamic topography in plan view and the associated surface geostrophic current field. The northward excursion of the jet associated with the PF persists at 105 W, as it has for the entire cruise. Our CTD cast here at 59-59 S, 105 W shows a sharp temperature minimum of 1.1 C, at about 200 m depth, a sign that we are south of the PF. The 27.9 neutral density surface is at 1080 m depth, another sign. We are fortunate that the PF has come so far north for us, since we are restricted from releasing floats south of 60 S.
.png)
Fig. 1. CTD station locations and yields for the tracer search, 8 to 10 February. The tracer release tracks are shown as red lines. Stations finding tracer are red, those that did not are black. Only stations 29 and 38 yielded broad profiles with high concentrations. The others yielded one or more low-concentration peaks.
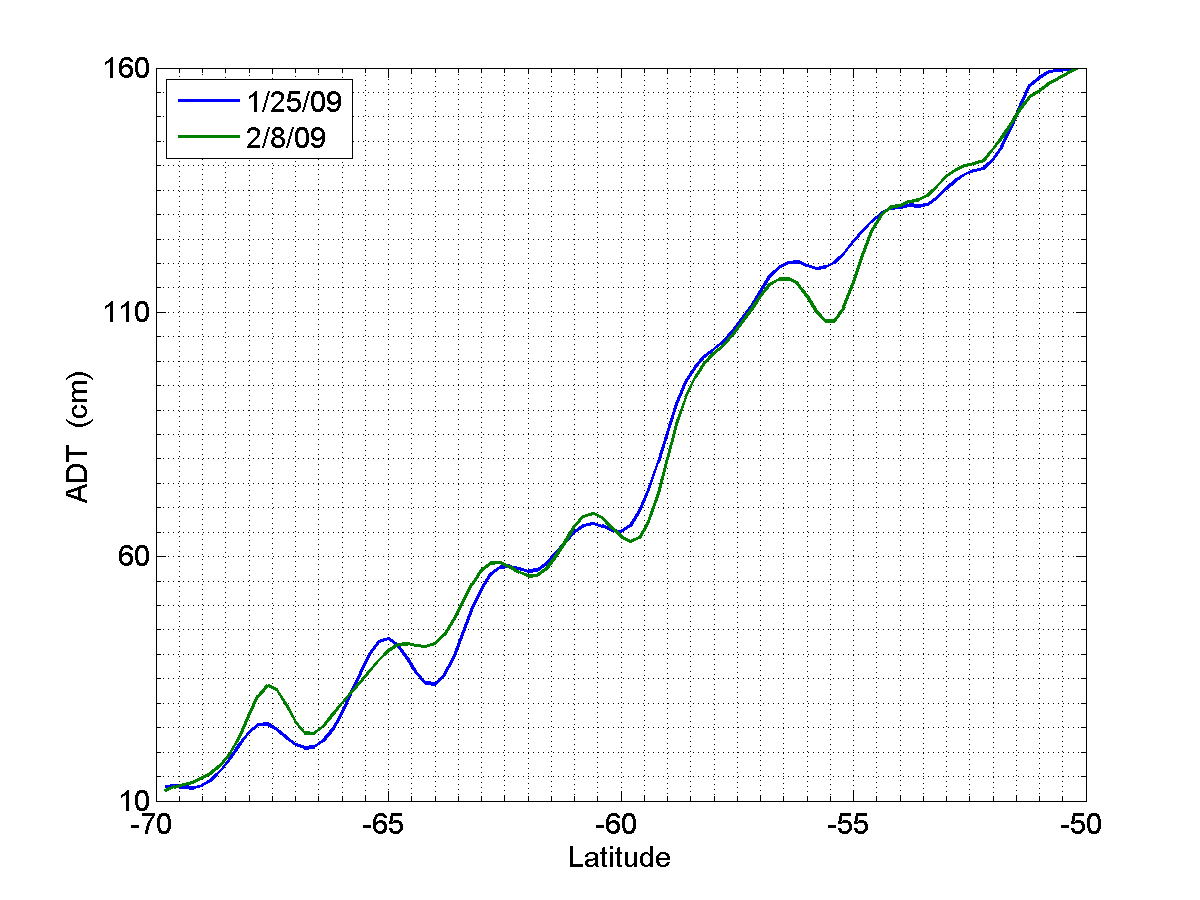
Fig. 2. Absolute Dynamic Topography at 105 W on 1/25/09 and on 2/8/09, from objective mapping of data from the AVISO project by Valery Kosneyrev.
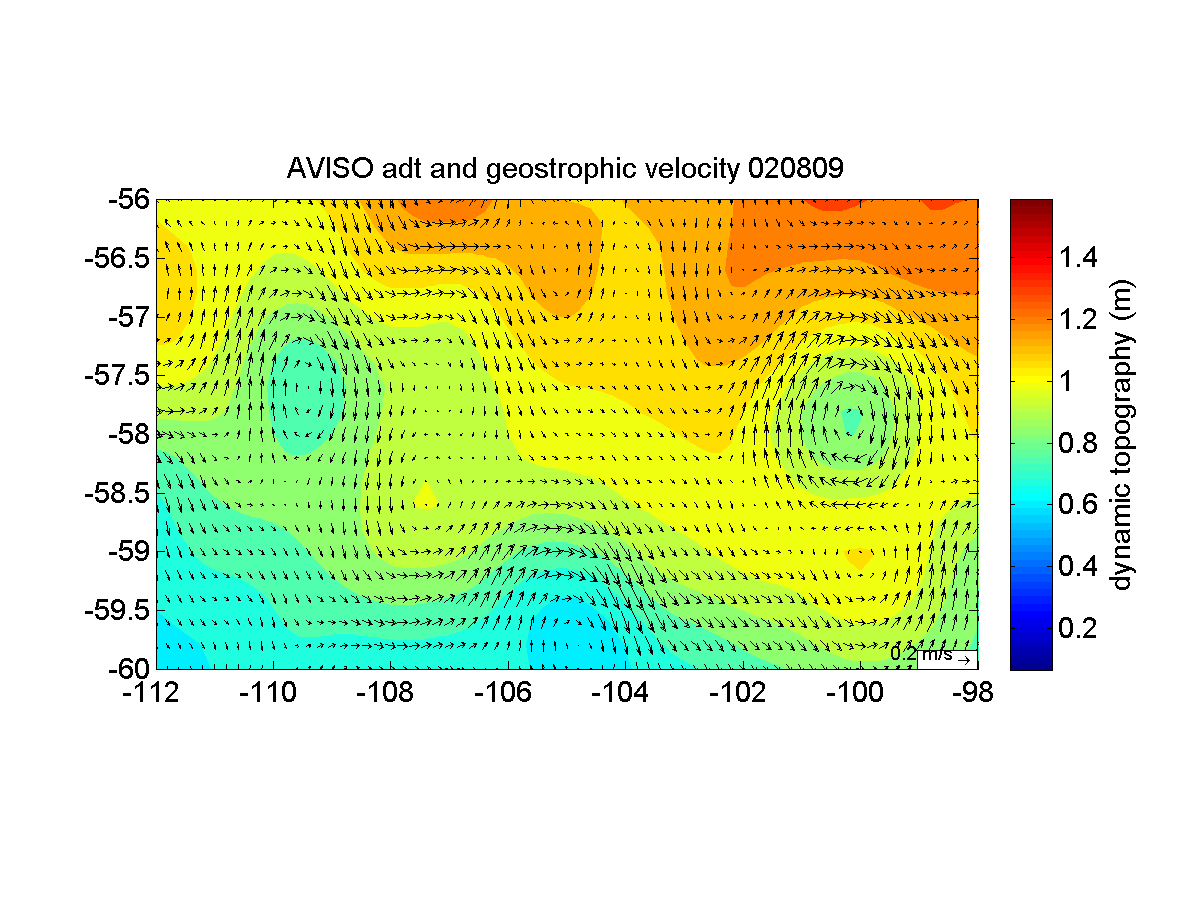
Fig. 3. Absolute Dynamic Topography and surface geostrophic velocity on 2/8/09. CTD data from Cast 48 tell us that we are south of the Polar Front at 60 S, 105 W.
12 February 2009
We are well on our way to finishing the CTD/LADCP/RAFOS line along 105 W, now heading to the station at 58 S. We will occupy one more station beyond that, at 57-30 S, 105 W, to better match this segment of the line with the one earlier that ended at 58 S. We crossed the Polar Front near 59 S. Here are the approximate temperatures at the temperature minima along the section, near 200 m depth:
We crossed the Polar Front near 59 S. Here are the approximate temperatures at the temperature minima along the section, near 200 m depth:
| Latitude | T at the Temperature Minimun |
| 59-59 | 1.1 |
| 59-45 | 1.4 |
| 59-30 | 1.7 |
| 59-25 | 1.7 |
| 59-00 | 2.1 |
| 58-45 | 3.1 |
| 58-30 | > 3.6 (T-minimum not well defined) |
So we see that the temperature at the temperature minimum went from 1.7 to 3.1 in the 30 miles between 59-30 and 58-45. This location is at the center of the strong jet implied between 58 and 60 S in the altimetry. So it appears that we have managed to release 12 RAFOS floats south of the PF, and one triplet perhaps “at” the PF (i.e., at the 2.1 deg point in the above list). The rest have been released north of the PF. It will take a closer look to decide where they are relative to the SAF, because that front seems rather smeared out at 105 W. However, we know where they were released relative to the ADT from the altimetry and to dynamic height relative to any reference level from the hydrography.
The science party has dived into setting up the towed sampling array for a first deployment tomorrow evening. The sea state still promises to be kind for the next few days at least, so we hope to do some tows without breaking the samplers. We will try to do a few CTD casts for tracer between tows (i.e., during the day – tows will be done at night) to sample tracer rich sites indicated by the output of the tows. But that means changing the wire from the sampling sled to the CTD/Rosette frame and back each day.
13 February 2009
We finished the line at 105 W this morning with the cast at 57-30 S, and then came back to the tracer injection area. A CTD cast was done near the middle of the area. It yielded no tracer, but this was a minor event of the day, as most hands were busy preparing the sampling array. Brian Guest, in particular, worked hard to assemble the sled that goes in the center of the array. We deployed the array starting about 1900 and finished around 2030. I dropped the messenger at 2107. The seas were as calm as they have been all trip, the wind having been just 10 knots or so all day. Conditions were excellent for a first deployment. The samplers were spaced 4 meters apart in most cases. This placed the sampler most recently put on the wire safely below the rub rail while the next one was put on the wire. The exceptions are the samplers below and above the sled. The sampler 4 meters below the sled rests on the hull above the rub rail. In rough seas it could be damaged. We found we had to lower the sled 5 meters below the sampler above it to get the sled safely in the water. In rougher seas this distance would have to be even greater. The deployment went extremely well. Now we wait until the morning to see what we fish up for tracer. The ship will attempt to hold a course of 210 through the center of the tracer injection area, at 1 knot, for 10 hours. We are in a field of ice bergs of all different shapes and sizes, making a surrealistic seascape with calm seas, snow squalls here and there, and yet with beams of sunlight shining through breaks in the clouds. The ship may have to maneuver to avoid these bergs during the sampler tow tonight.
14 February 2009
Our tow last night yielded a very nice profile, about 25 meters from tail to tail, so maybe about 8 meters rms. The center was probably about 6 meters below the target surface. We missed a critical sampler at -8 m due to a malfunction. The first 25 of the 50-chamber sampler seems to have found tracer in every chamber, so it is a mystery as to why the CTD casts so seldom found any. The GC is not stable – standards are varying by a factor of 2 over an hour or so and a factor of 10 over a day or so. I tightened the connector going in to the detector, and am baking the columns before analyzing the second 25 chambers.
We are now doing our second tow, 3 miles east and parallel to the first, with a course of 210, and trying a speed of 1.2 knots over the ground. The wire angle is much greater than at 1 knot, so there will be some corrections necessary for angle in the heights of the samplers. We do have 4 temperature sensors in the array, plus two Seacat CTDs, so corrections can indeed be made.
The weather continues quite calm. At the moment the wind speed is 2.4 knots! The sea state is perfect for launching and recovering the sled, as it was for the first tow.
15 February 2009
I woke up this morning to find that the new catalyst we installed to remove oxygen also removes some CF3SF5! There may have been a small effect of this kind from the one we were using, but not so strong. So today we ran the GC without the catalyst. The oxygen peaks were small from the small loop (0.11ml) but disproportionately large with the large loop (0.6 ml). So we used the small loop. This means we sacrificed a factor of 5.5 sensitivity, but this is of little importance so soon after injection, when the concentrations are high. GC operations went relatively well today after this correction.
Our second sampling tow, finished this morning, had almost no tracer in it. We were apparently east of the patch. During the day we did CTD casts where the first sampling tow indicated the highest tracer and we found very high concentrations at that site and 0.5 miles south of it. To the west 0.5 miles there was nothing. To the north 0.5 miles there was a narrow peak. We just pulled up the cast to the east, but I am going to bed, to run the samples tomorrow.
We called off the sampler tow for tonight for fear of too rough a sea state tomorrow morning. We are worried about the sled being beaten up while it sits near the surface waiting for recovery. So we have done a few extra CTD casts. However, we will sit idle for about 7.5 hours from 2330 to 0700. I have moved the night shift around to 1200-0000 and the morning shift around to 0800-2000, so I would have to reverse this to cover this coming watch. There is fatigue in most peoples’ faces – not all, but Brian, me, Leah, Cindy and Stew are very tired. I don’t feel the information we would get from a few early morning CTDs would be worth wearing people out even more. Spot CTDs are very ineffective at sampling a streaky patch, as anticipated.
16 February 2009
We continued our CTD casts today in fairly quiet seas, and we deployed the last of our floats: 1 shearmeter, 3 RAFOS floats, and 1 EM-APEX float. We are about to deploy the sampling array for the third tow.
The attached figure shows the results of our tracer sampling efforts thus far. One sees a large number of CTD casts. There are 10 that found tracer (red) and 23 that did not (black). The last set, from 58 to 65, were guided in location by the results of the first sampling tow, and also were spaced ½ mile apart, so it is no surprise that our success at finding the tracer improved. It is still difficult to find tracer with the CTD, however. For example, stations 60 and 62 found no tracer, just ½ mile on either side of a station 58, with high tracer. Another striking finding is that every syringe from Tow 1 found at least some tracer, while many CTD casts in the same vicinity found nothing. The syringes integrate over approximately 360 meters along the tow, with 50 of them filling sequentially over 10 miles. The implication seems to be that in the general area of the tracer streaks one is likely to encounter tracer within 360 meters of any location, but unlikely to encounter tracer in a 1-meter spot (the size of the CTD/Rosette system). The existence of filaments with widths on the order of 10 meters, separated by clear space on the order 100 meters would be consistent with this observation.
We have not analyzed the diapycnal distribution of the tracer yet in detail. However, all of the profiles thus far have a peak concentration not at the target isopycnal, but 4 to 12 meters below. The profiles are quite narrow, with an extent from tail to tail of 20 to 30 meters. The tracer plume seems to have sunk several meters due to a slight positive density anomaly of the tracer wake from the injection sled, as has appeared to be the case in prior injections; the wake is not turbulent enough to dilute the density anomaly. Our most important task is to determine whether the sinking is similar all along the streaks, and so we seek to sample as many different parts of the streaks as possible. So far we may have sampled only one part of one of the two injection streaks. We have two, or at most three, more sampling tows possible and a few CTD casts, hopefully in a different place than casts 58-65 in the remaining few days.
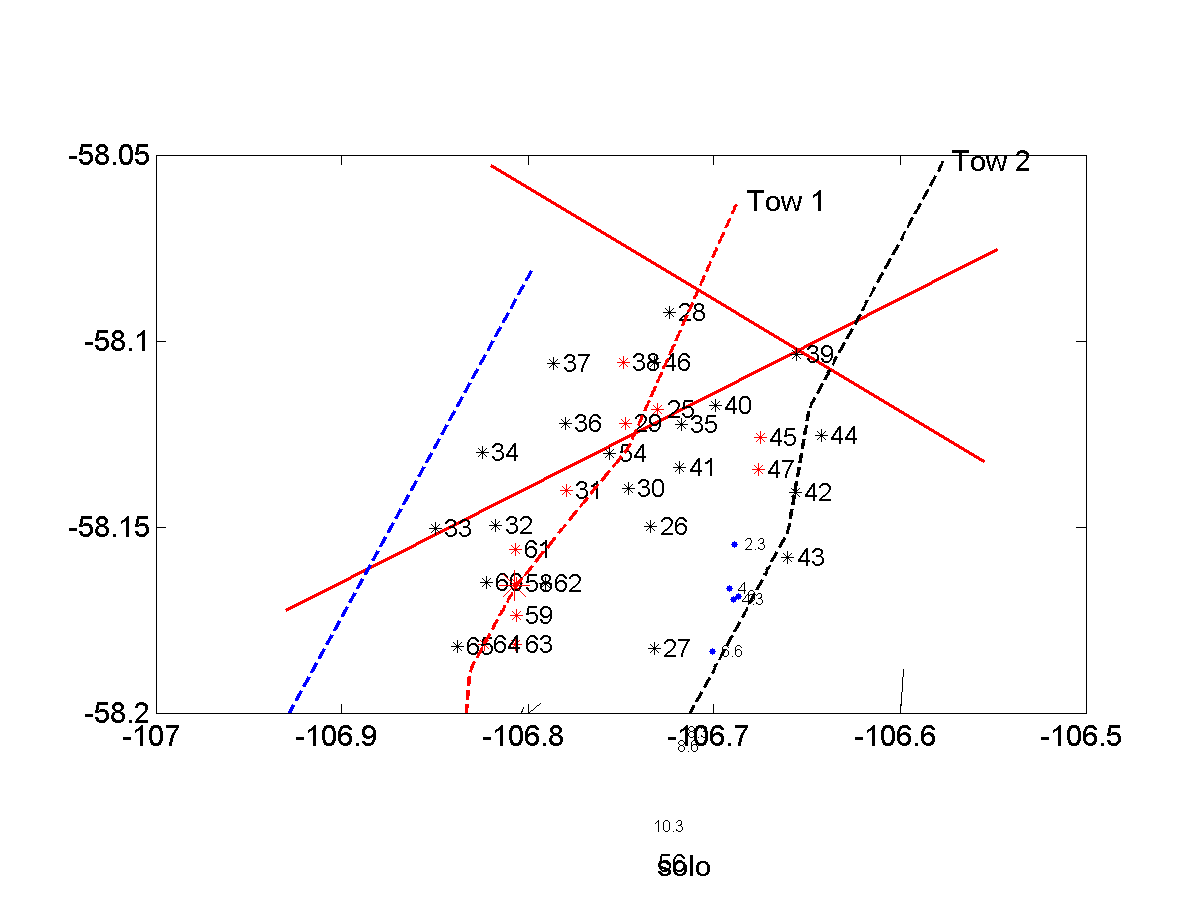
Figure Caption. Tracer Search. The solid red streaks are the original tracks for the injection. The asterisks mark CTD stations, red or black for tracer found or not found, respectively. The small blue dots indicate the start and end points of 2-day excursions at the target depth of an EM APEX float released near the intersection of the two injection tracks at the time of the injection, the small numbers indicating days since injection. The dashed red line is the track for the first tow, tracer being found all along it, with very high concentrations near the large red asterisk. The dashed black line is the track for the second tow, virtually no tracer being found along it. The dashed blue line is the prospective track for the third sampling tow.
17 February 2009
We completed our 3rd sampler tow this morning and the integrating samplers filled well. The profile obtained was modest in amplitude but very symmetric and centered 4 meters below the sled, i.e., the target density surface, with a rms width of about 4 meters, so very narrow. The maximum concentration was about 20 pM, which, if it were representative would imply that the tracer was dispersed over 2000 km^2. Tow 1 gave a concentration about 4 times greater and an rms width of about 6 m, and so would imply a patch size on the order of 400 km ^2, which seems more reasonable.
We did two more CTD casts today: one found no tracer, while the other found a little bit quite deep. We skipped a third CTD cast to go look for a shearmeter that came to the surface a little over 2 hours after we deployed it yesterday. We did not find it today, in spite of 2.5 hours of looking.
The fourth sampler tow is underway now. I have run the multichamber samplers from tow 3 and I find all the tracer toward the southern end of the tow. It is not at all clear whether we have sampled both injection streaks yet, or only one – seemingly the second one.
18 February 2009
Last night’s tow was a complete disaster, or nearly so. A messenger hung up after the fourth sampler in the top array. The valve was found closed on the sled sampler. The sampler below the sled was left out, which caused us to tow 12 meter below the target surface to make sure we got a good profile. As a result we have a dearth of samples between 20 meters below the target surface and 8 meters above! The sample at 8 meters above had tracer, as did at least two segments in the 50-chamber data. We are repeating this tow as I write and we will break off for Punta Arenas immediately after the tow is finished, around 0400 LT tomorrow.
The other activity today was to put the four seabird autonomous T-sensors and two CTDs on the sampler sled together for an intercalibration. We did this before with the CTD on the rosette system, so we should indirectly get a comparison with the sled CTD and the rosette CTD. The weather has been moderate, with nominally 14-foot seas according to the storm surf model site. Conditions are just on the edge for deploying and recovering the towed sampler system.
19 February 2009
The tow last night went well, with all samplers performing properly – in contrast to the disastrous tow of the night before. Recovery in the wee hours of the morning went smoothly, with a festive, “end of the cruise” atmosphere. We went over the same track as the previous night, except that it was 3 miles shorter because of the need to leave the site and head back. The surprise was that no tracer was found at all, again in contrast to the previous tow, which was rich in tracer in both the first and second halves of the tow. Such is the ocean, always in motion, and thumbing its nose at us. We do know the initial condition of the tracer well enough with the samples we have, but a tracer rich final tow would have been icing on the cake.
We are headed back now, having left at 0400 local time. Packing is going well. We have following seas and following winds and so are quite comfortable and cruising at better than 13 knots.