Cruise RR0901 Update22 January 2009
We have started a hydrographic survey line at 50 S, 105 W, and will head due south as far toward the ice edge around Antarctica as weather and time will allow. The survey is done with instruments that measure the conductivity, temperature and pressure of the water from which depth, salinity and density can be calculated. There is also a sensor for dissolved oxygen, and there is a separate instrument to measure the velocity of the water within a few hundred meters below the package using the Doppler effect acting on pulses of sound. There are bottles that can be closed when signaled to capture water to calibrate the salinity measurement (see first figure). All of this, called a CTD for short (for Conductivity, Temperature, Depth), is lowered on a conducting cable to the bottom, which is 4 to 5.5 kilometers (2.5 to 3 miles) beneath us.
We will occupy around 30 stations with this system on our line south. These will be supplemented with 20 or so Expendable Bathythermographs (XBTs), which measure temperature and relay it back to the ship via a fine wire. The positions of the stations will be guided by measurements of the sea surface height from altimeters orbiting the earth in satellites. The second figure below shows estimates of the sea surface height, relative to where it would be if the ocean were still, on 13 January 2009. The surface is generally higher in the north. In the southern hemisphere this means that the currents are generally to the east, i.e., with the higher pressure to the left. The sea surface height map, though, is filled with excursions and swirls that are analogous to the high and low pressure areas in the atmosphere, but occur at a smaller scale in the ocean. The Antarctic Circumpolar Current (ACC – acronyms seem unavoidable) is a turbulent stream, and our aim is to release neutrally buoyant drifters and a tracer in it at about 1500 m depth (a little under a mile) to measure the rate at which seawater components, heat, and momentum are transported across it.
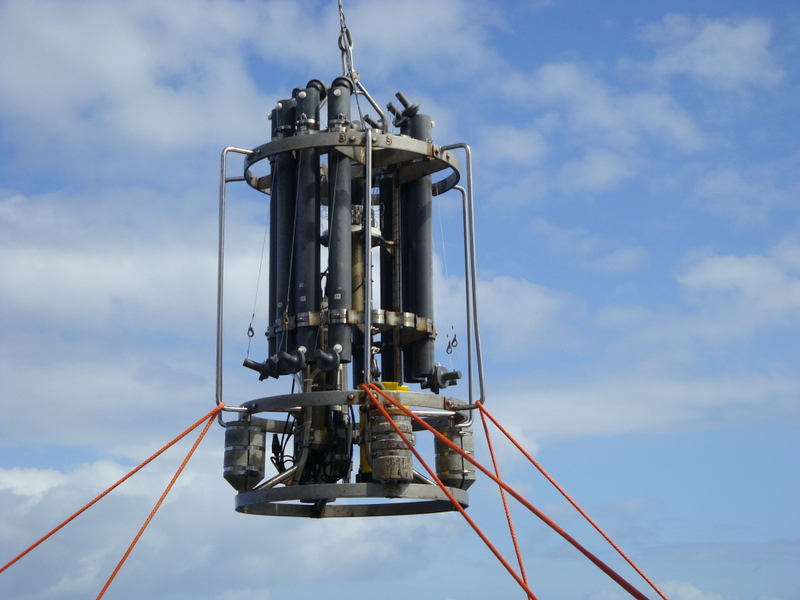
Our CTD system being lifted over the rail of the ship and about to be lowered into the ocean. The sensors are toward the bottom, on the left. The acoustic current meter is in the yellow cylinder behind one of the lead weights, and the PVC tubes with their caps cocked open are the water samplers, ready to be tripped when the operator sends the signal. The cable carries these signals down to the CTD, and also carries the readings from the sensors up to the ship as the CTD is lowered. This particular package is relatively small and is well weighted with the lead so that the cable does not go slack as the ship moves relative to the water, especially during deployment and recovery.
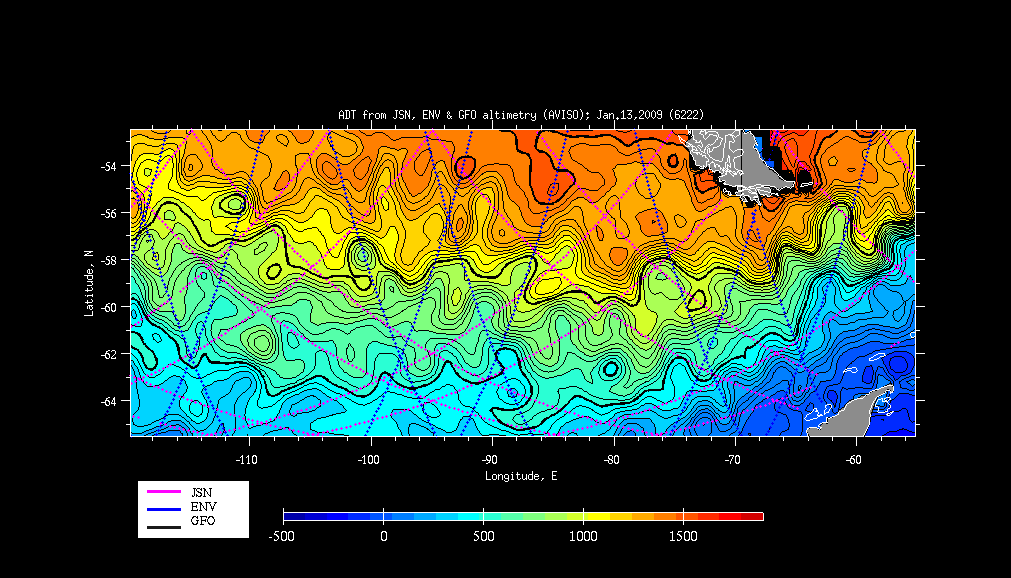
A map of the sea surface height, relative to an equilibrium surface, obtained from satellites equipped with altimeters. The scale is in millimeters so that the surface in the northern region here is 1500 mm (5 feet) higher than in the far south. Maps like this are prepared for us every day by Valery Kosneyrev at Woods Hole, and emailed to us.